sleep & stress
︎︎︎2021
︎︎︎data visualization
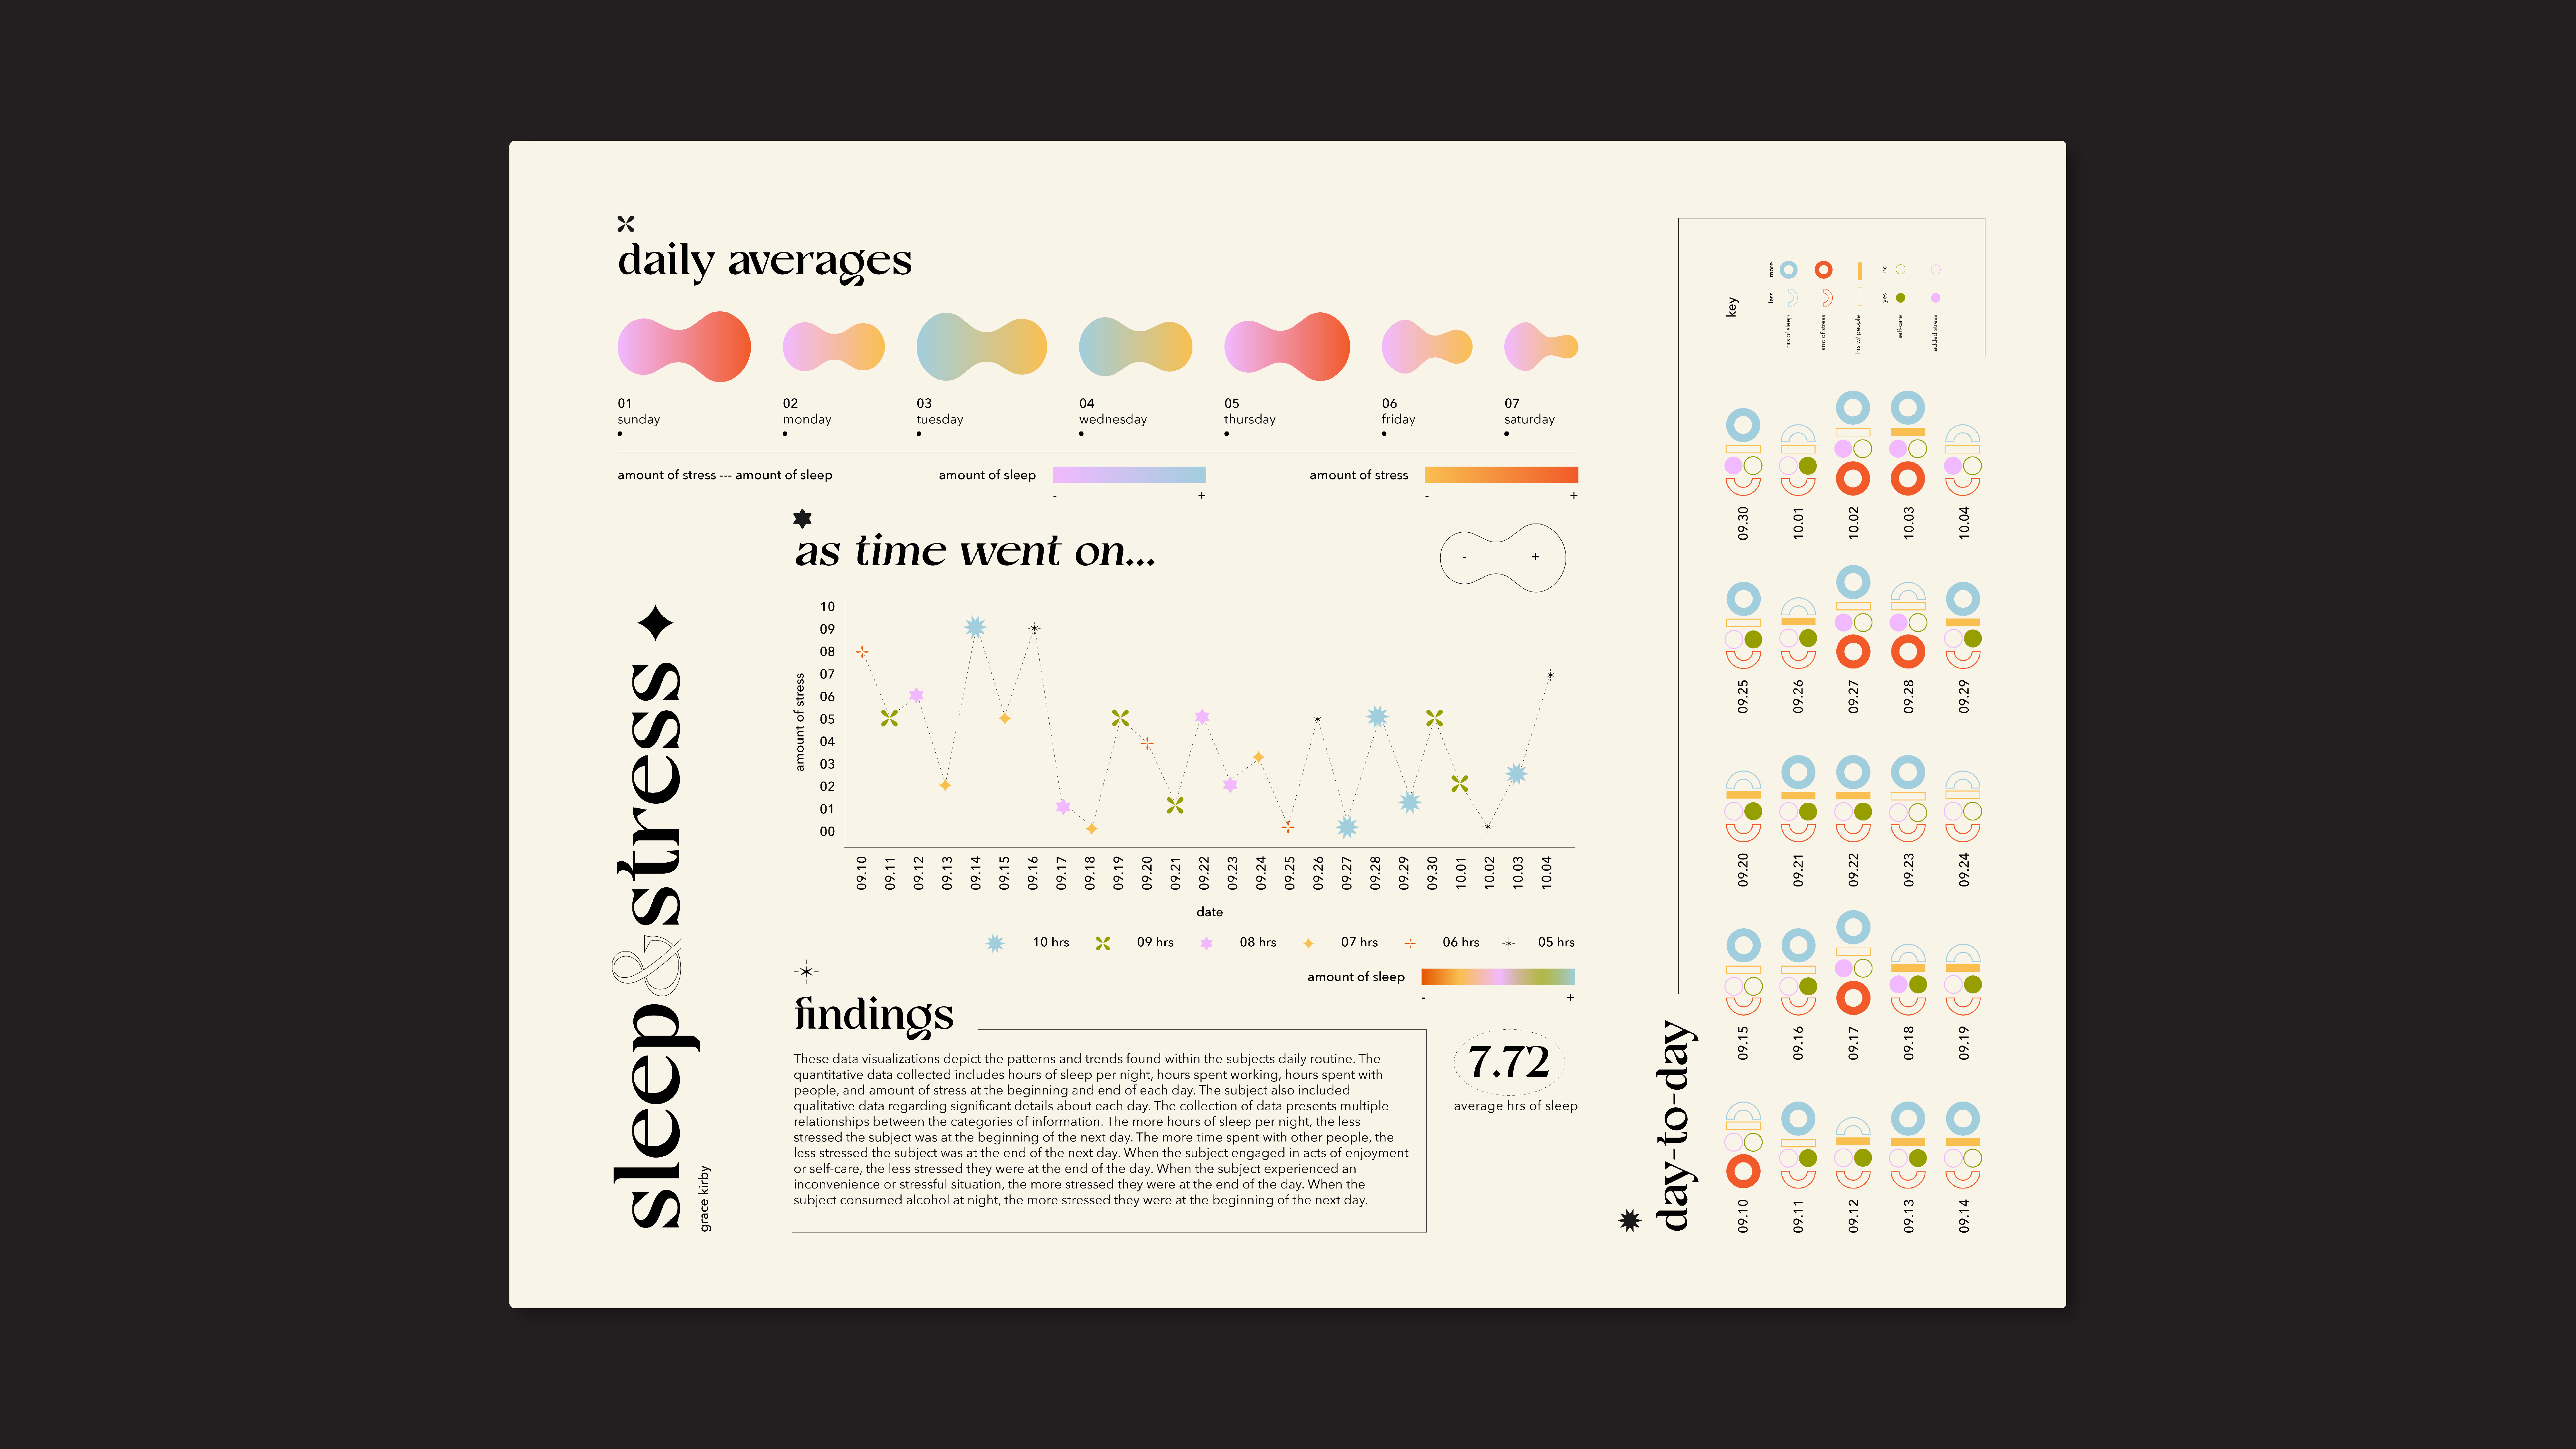
Using data collected by one of my peers, I created a group of visualizations outlining the trends and patterns found in her day-to-day routine over the course of a month. The quantitative data collected includes hours of sleep per night, hours spent working, hours spent with people, and amount of stress at the beginning and end of each day. The subject also included qualitative data regarding significant details about each day. The collection of data presents multiple relationships between the categories of information. The more hours of sleep per night, the less stressed the subject was at the beginning of the next day. The more time spent with other people, the less stressed the subject was at the end of the next day. When the subject engaged in acts of enjoyment or self-care, the less stressed they were at the end of the day. When the subject experienced an inconvenience or stressful situation, the more stressed they were at the end of the day. When the subject consumed alcohol at night, the more stressed they were at the beginning of the next day.
01. data visualization

02. a guide to self-care
The subject that collected this data set also included a written, diary-like entry on each of the days that they collected information. This qualitaive data reveals actual events and situtaions that they endured each day that contributed to the data. After reading the entries, I created a personalized zine that outlines the subject’s circumstantial, real-life contributions to their sleep, stress, and self-care. This zine includes direct quotes, secondary research, references to the quantitative data visualizations, and personal photos from the month that the subject spent gathering the data.